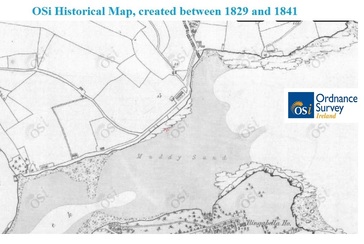
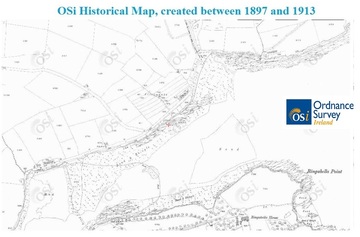
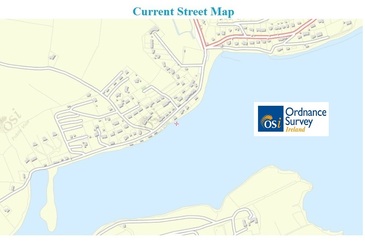
how fountainstown has changed since 1829.
Between 1829 and 1842 Ordnance Survey Ireland completed the first ever large-scale survey of an entire country. Acclaimed for their accuracy, these maps are regarded by cartographers as amongst the finest ever produced. As the national mapping archive service for Ireland, OSi has captured this and later mapping data in a digitised format. These maps are particularly relevant for genealogy or those with an interest in social history.
TO VIEW OSI HISTORICAL MAPS, CLICK HERE.
TO VIEW OSI HISTORICAL MAPS, CLICK HERE.
|
Ordinance Survey Ireland
(OSi) has gratefully given permission to include a link to their Mapview site,
where it is possible to view historical maps of all of Ireland.
A snap snot of the Fountainstown area can be seen by clicking on the images on the left. To view these maps in more detail, a link has been generated here, that will take you to the OSi website. On this OSi site, their Mapview software gives you tools to perform the following: · pan around the area being displayed (pan control on left side of map). · zoom in / zoom out of areas of interest (zoom control on left side of map). · change between the street map (2012), historical 25" map (1897-1913) and historical 6” map (1829-1841). By changing between maps, this give you an excellent picture as to how Fountainstown has changed over the years (the map change utility is located on right side of map). Along with the obvious increase in the number of houses in the area (from less than 20 homes in 1829 to around 200 in 2013), other observations that can be made when comparing maps include: · The movement, in a westerly direction, of the ferry point sand spit. · The absence of a complete coast road, linking Fountainstown to Myrtleville. · The presence of allotments where the club, caravan sites and houses are now built. TO VIEW OSI HISTORICAL MAPS, CLICK HERE. |


